Next: Heap corruption, Previous: Profiling, Up: Top
In addition to profiling, the mpatrol library also has the capability to concisely trace the details of every dynamic memory allocation, reallocation and deallocation over the lifetime of any program that it was linked and run with. This information can then be used to calculate trends in a program's memory allocation behaviour and provide details on the lifetimes of memory allocations. In contrast to profiling, it can also be used to display a program's memory allocation behaviour in real-time, along with some useful information that can be displayed in graphical or tabular form.
Only allocations, reallocations and deallocations are recorded. The intention of tracing is to gather concise details about each memory allocation event rather than complete information about some or all memory allocations. As a result, the mpatrol log files and profiling output files contain more detailed information about individual memory allocations, whereas the tracing output files contain a broader view of allocation behaviour throughout the entire program.
Memory allocation tracing is disabled by default, but can be enabled using the TRACE option. This writes all of the tracing data to a file called mpatrol.trace in the current directory at the end of program execution, but the name of this file can be changed using the TRACEFILE option and the default directory in which to place these files can be changed by setting the TRACEDIR environment variable.
The mptrace command is a tool designed to read a tracing output file produced by the mpatrol library and display the tracing information that was obtained. The tracing information is a concise encoded trace of all of the memory allocation events that occurred during a program's execution, and can be decoded into tabular or graphical form, along with any relevant statistics that can be calculated.
The mptrace command also attempts to calculate the endianness of the processor that produced the tracing output file and reads the file accordingly. This means that it is possible to use mptrace on a SPARC machine to read a tracing output file that was produced on an Intel 80x86 machine, for example. However, this will only work if the processor that produced the tracing output file has the same word size as the processor that is running the mptrace command. For example, reading a 64-bit tracing output file on a 32-bit machine will not work.
In addition, the tracing output file also contains the version number of the mpatrol library which produced it. If the major version number that is embedded in the tracing output file is newer that the version of mpatrol that mptrace came with then mptrace will refuse to read the file. You should download the latest version of mpatrol in that case. The reason for storing the version number is so that the format of the tracing output file can change between releases of mpatrol, but also allow mptrace to cope with older versions.
Along with the usual --help and --version options, the mptrace command accepts several other options and takes one optional argument which must be a valid mpatrol tracing output filename but if it is omitted then it will use mpatrol.trace as the name of the file to use. If the filename argument is given as `-' then the standard input file stream will be used as the tracing output file.
Normally, the mptrace command will simply read in the tracing output file and display any statistics it has gathered. However, it can also be instructed to display a tracing table which displays useful details for every event in the tracing output file. The tracing table can be displayed with the --verbose option. If the mpatrol library was able to obtain source-level information for one or more memory events then this can be displayed in the tracing table by adding the --source option.
A C source file containing a trace-driven memory allocation simulation program can be written with the --sim-file option. This program will have the identical memory allocation behaviour to the program which produced the original trace file. This option can be useful to use if you wish to determine which malloc library is most suitable to use for a specific application.
A trace file in Heap Allocation Trace Format (HATF) can also be written out by the mptrace command by using the --hatf-file option. It takes the name of the HATF trace file to be written as an argument and writes out the HATF version of the mpatrol tracing output file given as input when it is being processed. The HATF file format is an attempt to standardise trace file formats for memory allocation tracing, and is being developed by Benjamin Zorn, Richard Jones and Trishul Chilimbi. There is a HATF DTD located in the extra directory in the mpatrol distribution.
The mptrace command will normally be built with GUI1 support on UNIX platforms that are running X Windows. This means that a graphical memory map display of the heap will be shown in a window every time mptrace is run with the --gui option. This display is updated every time a new event is read from the tracing output file and by default uses the colour red for internal heap memory (used by the mpatrol library), blue for unallocated heap memory, black for allocated memory and white for free memory. Options exist to change this colour scheme, as well as the dimensions of the drawing area and the window.
By default, it is assumed that the start address of the first event that appears in the tracing output file is the base address of the memory map displayed in the window. If the heap grows downwards then this assumption will be incorrect (since nothing will be displayed) and so the --base option must be used to specify a reasonable lower bound for the final memory map. In addition, the visible address space displayed in the memory map is fixed to a certain size (4 megabytes by default), but this can be changed with the --space option. A small delay can also be added after drawing each memory allocation event through the use of the --delay option.
The following options are specific to the GUI version of mptrace and are read by the X command line parser rather than directly by mptrace. As a result they are parsed according to X toolkit rules and do not appear in the quick-reference option summary produced by the --help option. The application class for setting mptrace X resources is called `MPTrace'.
We'll now look at an example of using the mpatrol library to trace the dynamic memory allocations in a program. As with the previous chapter we will attempt to trace a real application in order to examine its memory allocation behaviour. Since all of the following steps were performed on a Solaris machine, the --dynamic option of the mpatrol command was used to allow us to replace the system memory allocation routines with mpatrol's routines without requiring a relink. It also means that we can trace all of the child processes that were created by the application as well.
The application that we are going to trace is the GNU C compiler, as before, and we will discard the tracing information generated for the assembler and linker. All of the command line examples use the bash shell but in most cases these will work in other shells with a minimal amount of changes.
We will use tests/profile/test2.c as the source file to compile with gcc and we'll turn on optimisation in order to cause gcc to allocate a bit more memory than it would normally. Note that use is also made of the format string feature of the --log-file and --trace-file options so that it is clear which mpatrol log and tracing output files belong to which processes.
     bash$ mpatrol --dynamic --log-file=%p.log --trace-file=%p.trace
                   --trace gcc -O -o test2 test2.c
     bash$ ls *.log *.trace
     as.log         cc1.trace      cpp.log        gcc.trace
     as.trace       collect2.log   cpp.trace      ld.log
     cc1.log        collect2.trace gcc.log        ld.trace
As mentioned above, we're not interested in the mpatrol log and tracing output files for as and ld so we'll delete them. We can now use mptrace to decode each of the tracing output files produced and write their contents in tabular form to the standard output file stream, which can be redirected to a file for later viewing. You can find these tracing output files in the extra directory in the mpatrol distribution.
Note that both the tracing files mentioned above and the examples below treat reallocations as a deallocation followed by an allocation. This was the behaviour in older versions of the mpatrol library and I haven't bothered to update the files. However, it shouldn't affect the final outcome in any way. In addition, as the mpatrol.h header file was not included by any of the source files that comprise the compiler and its toolset, there was no source-level information for memory events. If there was, the --source option could have been used to display it.
     bash$ rm as.log as.trace ld.log ld.trace
     bash$ ls *.trace
     cc1.trace      collect2.trace cpp.trace      gcc.trace
     bash$ for file in *.trace
     > do
     >     mptrace --verbose $file >`basename $file .trace`.res
     > done
     bash$ ls *.res
     cc1.res        collect2.res   cpp.res        gcc.res
For the purposes of this example we will only be looking at the tracing results for the cc1 compiler which are now decoded in the file cc1.res. If you examine this file you will see something similar to the following. Note that the `...' marks text that has been removed.
      event  type     index  allocation      size    life   count     bytes
     ------  ------  ------  ----------  --------  ------  ------  --------
             internal        0x0024E000     32768
             internal        0x00256000     32768
             internal        0x0025E000     32768
             reserve         0x00266000      8192
             internal        0x00268000     32768
             internal        0x00270000     32768
             internal        0x00278000     32768
             internal        0x00280000     32768
             internal        0x00288000     32768
             internal        0x00290000     32768
     ...
             reserve         0x00308000     16384
          1  alloc       19  0x00266568      4072               1      4072
          2  alloc       21  0x0030A008      4072               2      8144
          3  alloc       22  0x0030AFF0      4072               3     12216
             reserve         0x0030C000      8192
          4  alloc       23  0x0030BFD8      4072               4     16288
          5  alloc       24  0x0030CFC0      4072               5     20360
             reserve         0x0030E000      8192
          6  alloc       25  0x0030DFA8      4072               6     24432
          7  alloc       26  0x00267550        42               7     24474
     ...
       1712  free       650  0x00373FF0      4072     827     398    321191
       1713  free       649  0x00376FA8      4072     829     397    317119
       1714  alloc     1074  0x00376FA8      4072             398    321191
       1715  free       233  0x0031ED18      8200    1498     397    312991
       1716  free       234  0x00320D20      8200    1498     396    304791
       1717  free       299  0x00355CC8       620    1426     395    304171
       1718  free       655  0x00353A28      1016     823     394    303155
       1719  free       303  0x0035E000      5096    1424     393    298059
       1720  free       653  0x00354E60       152     827     392    297907
       1721  free       654  0x00354EF8       152     827     391    297755

     memory allocation tracing statistics
     ------------------------------------
     allocated: 1056 (540776 bytes)
     freed:     665 (243021 bytes)
     unfreed:   391 (297755 bytes)
     peak:      489 (375169 bytes)
     reserved:  48 (409600 bytes)
     internal:  27 (884736 bytes)
     total:     75 (1294336 bytes)

     smallest size: 3 bytes
     largest size:  8200 bytes
     average size:  512 bytes
There are eight different columns of data displayed by the mptrace command when it decodes the tracing output file and displays it in tabular format with the --verbose option. Here is an explanation for each of them.
The first few entries in the table show that the mpatrol library started by allocating memory from the heap for its own purposes before reserving 8192 bytes for the memory allocations made by the object file access library for reading the symbols from the executable file and shared libraries2. Most of the further internal heap reservation events are due to the mpatrol library having to store details for all of the relevant symbols that it could read at program startup. The more symbols that there are, the more memory that must be used to store them. Note that the heap reservation events are not really relevant to the analysis of the program's memory allocations but they are used when displaying the heap graphically.
The first few memory allocation events in the table show that several memory allocations of 4072 bytes are being made along with several more heap reservations that are needed to store them. The last events in the table are mainly all deallocation events of allocations that were made quite early on in the program. The lifetime information for these events shows that some of these allocations were made very near the beginning of the program, while the others were made near the middle. None of them were very big and so would not be occupying much memory.
The statistics that were gathered from the tracing output file are displayed after the tracing table. The first group of entries summarise the heap memory that was used, with the `allocated', `freed' and `unfreed' fields showing the total number of memory allocations that were made, the total number of memory allocations that were freed, and the total number of unfreed memory allocations respectively. The `peak' field shows the highest number of memory allocations (and total number of bytes) that were in use at any one time. The `reserved' and `internal' fields show the total number of pages reserved from the system heap for user allocations and internal allocations respectively, and the `total' field shows the total number of pages that were used from the system heap.
The `smallest size' and `largest size' fields indicate the sizes of the smallest memory allocation and the largest memory allocation respectively. The `average size' field shows the mean number of bytes that was allocated between each of the memory allocations.
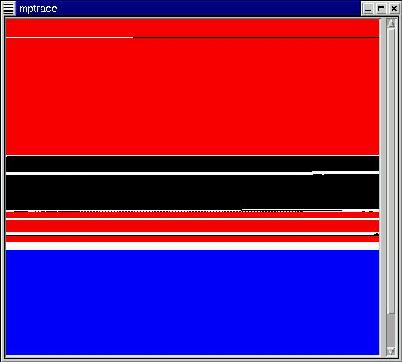
If you were running a GUI version of mptrace, information about all of these events can be displayed in graphical form inside a window if the --gui option is used. The following screenshot shows the mptrace display window when it is run with the --gui option and cc1.trace as input. It was generated using the --space 2 option.
Areas coloured blue indicate heap memory that has not yet been used by the mpatrol library (i.e. it has not currently been allocated from the system, or is currently being used by a part of the program that is not being tracked by the mpatrol library). Areas coloured red indicated heap memory that is being used internally by the mpatrol library. In this example, the reason that there is so much internal memory being used is that there are a large number of symbols that were read from the executable file and shared libraries. The narrow band of black and white lines at the top of the memory map represents the memory that was used by the object file access library when it was reading the symbols.
The large black bands in the middle of the memory map indicate memory that was still allocated at program termination. While this is a substantial amount compared to the amount of free memory, it does not necessary indicate memory leaks as the memory could be being used right up until the end of the program, and is implicitly freed at program termination anyway.
Unlike memory allocation profiling which summarises all of the accumulated data, it is possible to trace memory allocation events in real-time as the program runs. This can currently be done on UNIX platforms by piping the tracing output file from the program being run to the mptrace command, which can be achieved in several ways depending on the UNIX system that you are using. Both of the following methods are equivalent, where testprog is the name of the program that is being traced (and has previously been linked with the mpatrol library).
     # This method specifies the standard output file stream as the
     # destination for the tracing output file and then runs both
     # commands in a shell command pipe.  This has a disadvantage in
     # that testprog must not write anything to stdout since that would
     # be written out to the tracing output file.  If stdout is not
     # suitable then stderr could be used instead if you redirect it.

     bash$ mpatrol --trace-file=stdout --trace ./testprog | mptrace --verbose -
     # This method creates a named pipe called myfifo (but it could be
     # called anything) and runs the program being traced and the mptrace
     # command separately (perhaps in two separate windows).  If the
     # mkfifo command is not available on your system then try mknod.

     bash$ mkfifo myfifo
     bash$ mpatrol --trace-file=myfifo --trace ./testprog &
     bash$ mptrace --verbose myfifo
The idea for graphically displaying a memory map of the heap comes from the xmem tool supplied with the University of Toronto Computer Systems Research Institute malloc library, written by Mark Moraes. However, the documentation for that tool remarks that it was written as a quick and dirty hack. The mptrace command is hopefully more stable and contains a lot more functionality.
The mpatrol library can also generate trace files in a format that is compatible
with the GNU mtrace() option. The code to do this is built on top of the
mpatrol library and is in tools/mtrace.c and tools/mtrace.h. Such
trace files can then be processed by the GNU mtrace command. The
tools/mgauge.c and tools/mgauge.h files in the same directory
can be used to implement an allocated memory gauge which updates in real-time
in a terminal window. This can be used as an alternative to the window used by
the mptrace command's --gui option for a simpler display.